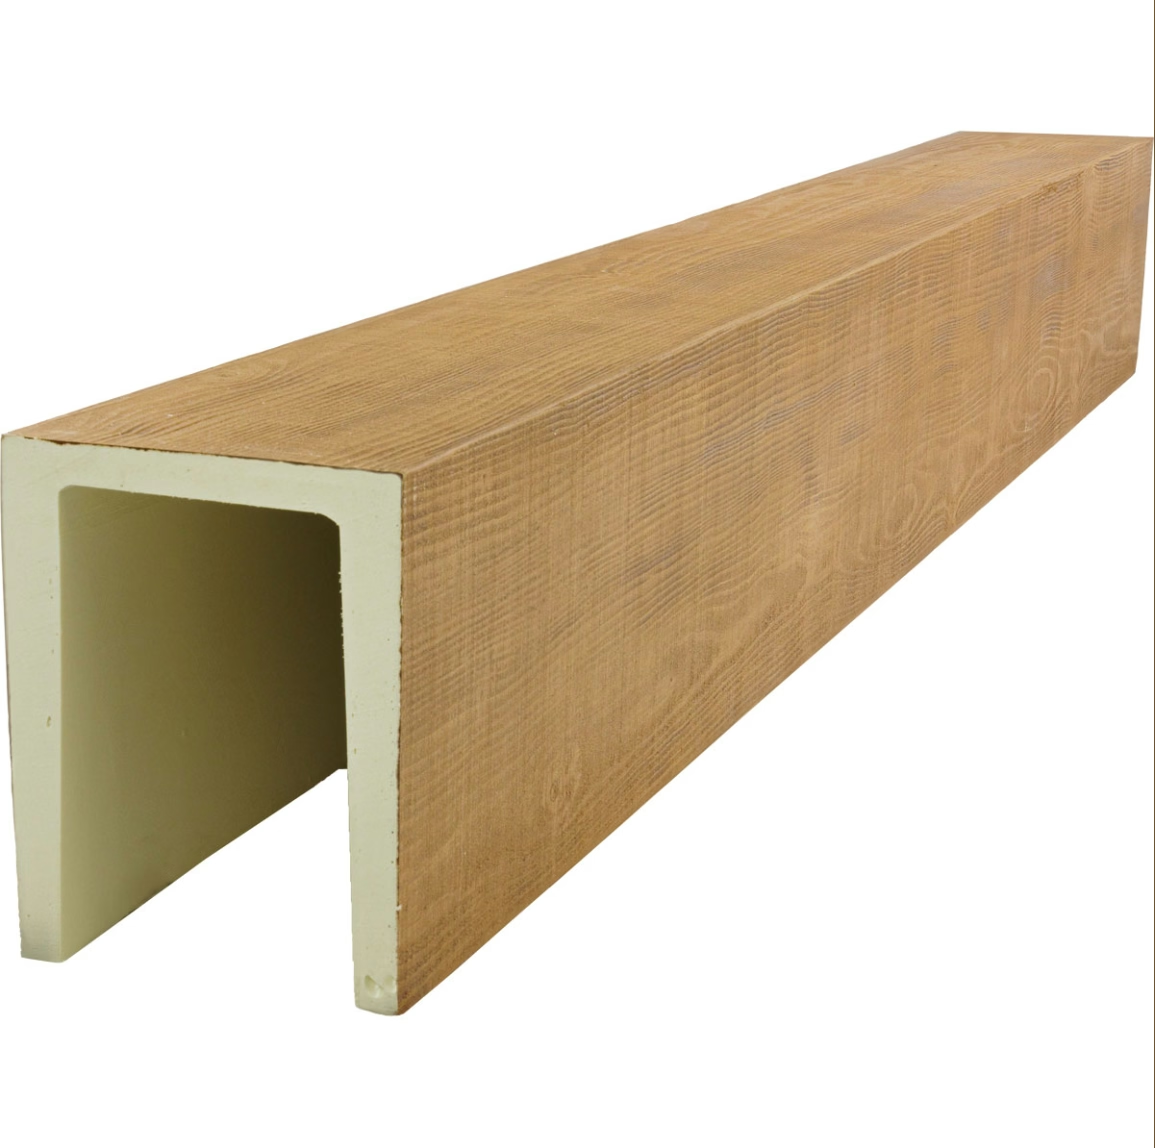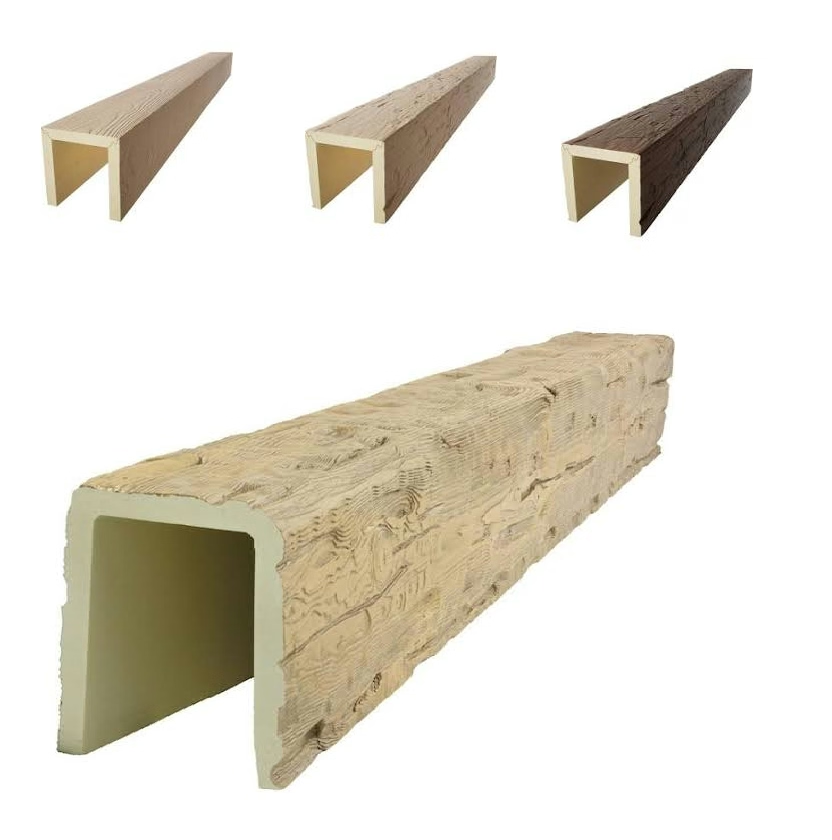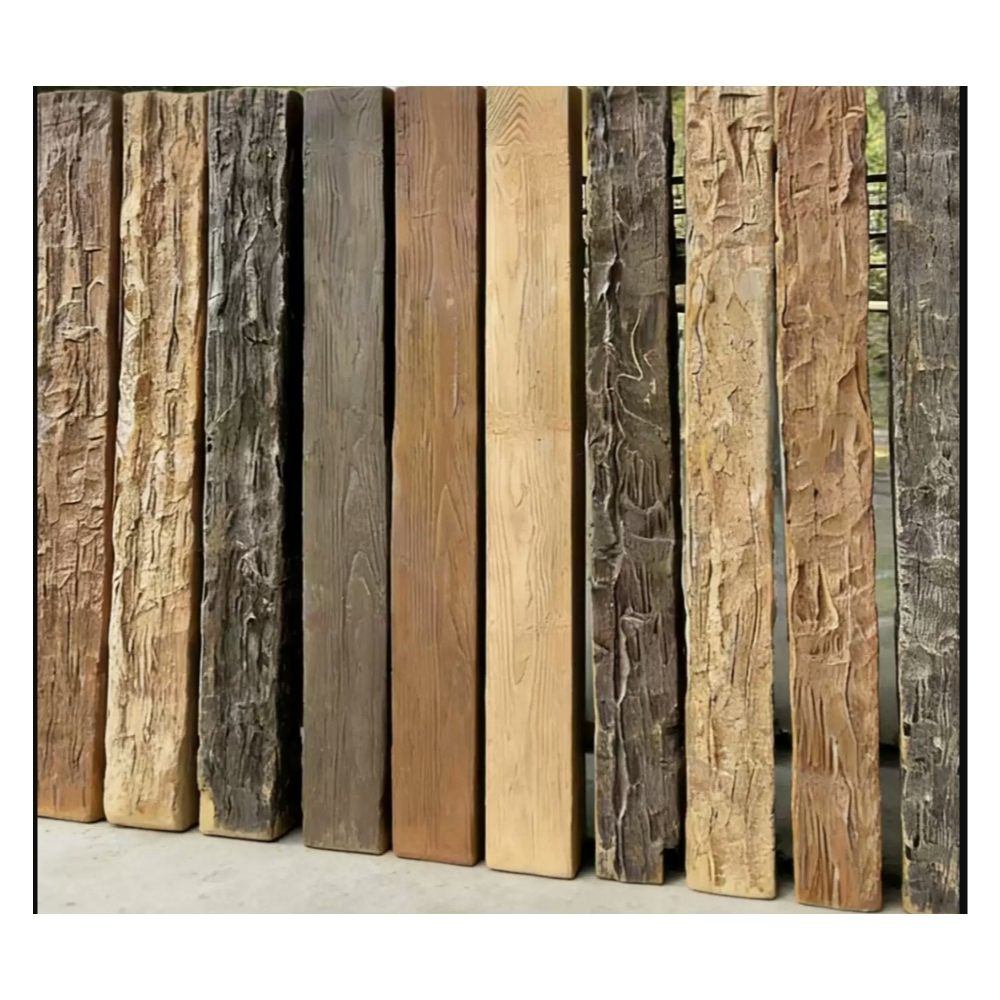
Weather resistance test reports contain technical data characterizing how polyurethane faux timber beams perform when exposed to environmental stressors. Interpreting these documents correctly enables specification of appropriate products for specific applications and establishes realistic performance expectations for building owners. Understanding testing methodology and result significance transforms raw data into actionable specification guidance.
Report Organization and Required Elements
Test reports begin with administrative identification including testing laboratory name, accreditation number, and report control numbers enabling document traceability. Laboratory accreditation to ISO 17025 standards confirms competence and ensures result validity. Report dates establish testing currency relative to specification timelines.
Product identification sections describe tested materials with sufficient detail to verify correlation with products intended for installation. This includes manufacturer identification, product code numbers, formulation details, and physical dimensions of test specimens. Photographs document specimen conditions before, during, and after testing.
Test method citations identify the specific standard procedures followed during testing. Method citations should be complete with standard number, revision year, and any referenced amendments. Deviations from standard methods should be documented with justification for the variation.
Test Method Detail Interpretation
Accelerated weathering sections describe test apparatus, radiation sources, cycle conditions, and total exposure duration. QUV testing details should specify lamp type (UVA-340 or UVB-313), irradiance level in W/m²/nm, and temperature setpoints for both UV and condensation cycles. Total kilojoules per square meter of UV exposure enables correlation with field exposure.
Water immersion testing describes specimen preparation, immersion duration, and evaluation criteria. Mass measurements before and after immersion establish water absorption percentages. Visual inspection documents surface changes, blistering, or delamination. Weight gain above specified thresholds indicates inadequate moisture resistance.
Thermal cycling protocols describe temperature extremes, ramp rates, dwell times, and cycle count. Cycling between -20°F and +180°F represents typical extreme range for temperate climate applications. Modified ranges apply for extreme climate specifications. Cycle counts from 25 to 300+ represent increasingly severe exposure scenarios.
Physical Property Testing Results
Tensile strength and elongation testing measures resistance to pulling forces and ductility before and after environmental exposure. Results reported in megapascals (MPa) or pounds per square inch (psi) indicate load capacity. Elongation at break percentages indicate whether materials remain ductile or become brittle following exposure. Property retention percentages comparing exposed to unexposed specimens quantify degradation.
Impact resistance testing measures ability to absorb sudden loading without cracking or shattering. Izod or Gardner impact testing provides comparative data before and after environmental exposure. Retained impact resistance indicates whether materials remain suitable for applications involving accidental impact.
Flexural testing measures beam behavior under concentrated loading at midspan, simulating gravitational loads and spanning conditions. Flexural modulus indicates stiffness; flexural strength indicates maximum load capacity. Changes following environmental exposure indicate whether structural characteristics degrade to unacceptable levels.
Appearance Retention Assessment
Colorimetry measurements provide objective quantification of appearance changes through standardized color space measurements. Lab* color coordinates enable calculation of total color difference (Delta-E) representing perceivable color shift magnitude. Delta-E values below 1.0 are imperceptible to most observers; values above 5.0 become visually apparent.
Gloss measurements quantify surface reflectivity using standardized geometries (20°, 60°, or 85° geometries appropriate for different sheen levels). Gloss retention percentages compare post-exposure readings to initial values, with higher retention indicating better surface durability. Severe gloss loss indicates surface chalking from UV degradation.
Surface imaging documentation through standardized photography captures visual appearance at defined exposure intervals. Consistent lighting, background, and imaging geometry enable meaningful comparison across test duration. High-resolution imaging reveals cracking, checking, chalking, and erosion invisible in casual observation.
Applying Test Data to Specifications
Specification development should reference specific test report numbers establishing documented basis for product requirements. Generic performance claims without test documentation create compliance verification difficulties. Specific report citations provide traceable connection between specification requirements and supporting evidence.
Test result comparison against project-specific performance requirements identifies acceptable products. Applications in harsh environments require more stringent thresholds than protected interior conditions. Specifying performance requirements without reference to realistic thresholds creates procurement difficulties.
Comparative analysis across multiple test reports enables product selection based on documented performance. Side-by-side comparison of property retention percentages, appearance retention, and failure modes identifies superior products for demanding applications. Documentation quality and testing completeness influence confidence in reported results.
Test Report Limitations and Validity
Scope limitations define conditions under which reported results apply. Testing conducted on one profile size may not represent performance of significantly different cross-sections. Color testing of one finish may not predict performance of different pigmentation systems. Understanding scope limitations prevents inappropriate extrapolation of test results.
Test report currency matters because formulation improvements may render older test data obsolete. Ideally, test reports less than three years old support current specification. Longer intervals between testing and specification warrant inquiry about current formulation status and whether re-testing has been conducted.
Testing laboratory reputation affects result credibility. ISO 17025 accreditation indicates systematic quality control, but individual laboratories vary in competence and rigor. Known testing laboratories with established reputations provide more confidence than unknown entities producing undocumented results.
Technical References
ASTM standards cited in every specification
Test Data
Lab results from internal testing program
Updated 2026
Reviewed against current product specs